Blog
Publish: 17 Sep 26Reading Time: 5 Min
A CBAM calculation follows a different logic from a corporate carbon accounting exercise. At its centre sit the production process rather than the company, the tonne of product rather than the year, and the traceable measurement rather than the estimate. This article sets out the order in which the calculation is built, the decisions required at each stage, and where verifiers concentrate their attention.
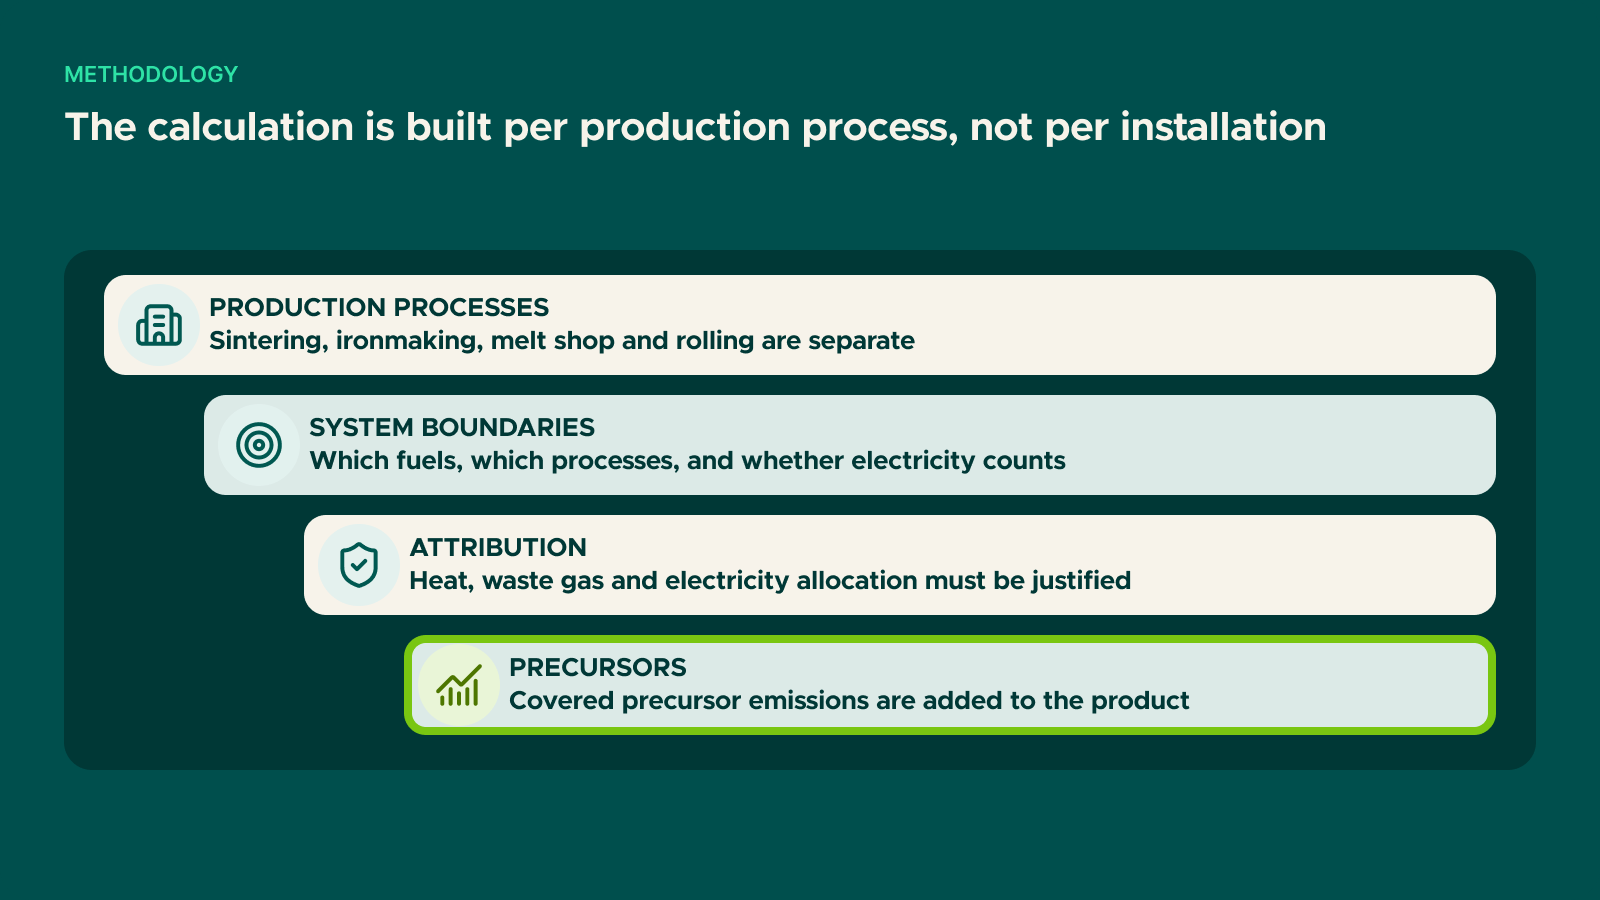
The calculation is not built for the installation as a whole but for the production processes inside it. In a steel plant, sintering, ironmaking, the melt shop and the rolling mill are separate processes with their own inputs, emissions and outputs. If the process definition is wrong, everything downstream shifts.
The Regulation defines these processes in its Annexes, aligned with EU ETS methodology. The first control question is whether the processes actually running in the plant map onto the defined ones. Where they do not — two processes combined on one line, or a process outsourced — the reasoning behind the mapping must be documented.
The boundary determines which emissions enter the calculation. Three questions settle it:
Items excluded from the boundary must also be documented. Verifiers examine the justification for exclusions as closely as the treatment of inclusions, and unjustified exclusions are the single most common source of findings.
Embedded emissions are expressed per tonne of product, and the functional unit is the tonnage produced under the same CN code. The calculation is therefore built per code, not per brand or per customer.
Two sectors have special rules. In cement the carrier is clinker, so the embedded emissions of cement are built on its clinker content — which makes the clinker factor the strongest lever in the sector. In fertilisers the functional unit is built on nitrate content, so two products of equal weight but different nutrient content carry different figures.
Each emission source needs a defined monitoring method, recorded in a written monitoring methodology document. This is the first document a verifier asks for, and it sets the scope of the verification. It covers the source list, the measurement method for each source, emission factors and their provenance, data collection frequency, responsibilities, data quality controls and an uncertainty assessment.
Data sources form a hierarchy of evidential strength: continuous measurement and weighing records are strongest, invoices come next, laboratory analyses are required for composition data, and default factors are the last resort. A verifier will ask why a given method was chosen over a stronger alternative.
The most common weakness is data that exists but is not traceable: production quantity in the ERP that does not reconcile to weighbridge records, fuel consumption known in total but not split by process, analyses available but with no documented sampling frequency. These gaps cannot be closed retrospectively.
Emissions from co-generated heat and electricity are allocated between them, and the basis for the allocation must be documented. Heat or electricity sold outside the installation is deducted from the amount attributed to the product.
In steelmaking, blast furnace gas, converter gas and coke oven gas are used as fuel in other processes. Whether the associated emissions are attributed to the producing or the consuming process is governed by rules in the Annexes, and the treatment materially changes the result.
Where one line produces goods under several codes, emissions are allocated between them. The basis is expected to reflect real process intensity; a flat allocation by tonnage is difficult to defend where thickness or the number of operations differs substantially.
The emissions of covered precursors are added to the final product's figure. Where a precursor is purchased, verified supplier data is required; where it is unavailable, a default value plus mark-up applies — 10% for 2026, 20% for 2027, 30% from 2028.
This pushes the calculation out into the supply chain. Mapping covered precursors by supplier, and writing the data request into supply contracts, is therefore part of the 2026 workload rather than a later refinement. For complex goods, weighted averages or a combination of actual and default values are permitted.
The emissions report template and the mandatory datasets for verification are set out in the Annexes. Producers frequently raise the concern that production recipes and efficiency data will be exposed to customers. The rules address this: a summary report can be produced for commercially sensitive information. The verifier sees the full dataset; what reaches the customer can be a summary.
A second route for sharing is the CBAM Registry's module for third-country operators, where installation and emissions data can be entered once and made available to several EU customers. We cover it in the CBAM Registry and O3CI operator portal, and the underlying concepts in CBAM embedded emissions explained.
In practice it draws on production, energy and quality data together; no single function holds enough. Involving the people who will answer verifier questions in the build shortens verification noticeably.
National inventory factors, IPCC factors or installation-specific analyses. Installation-specific analysis is always stronger evidence, since fuel and raw material composition varies widely.
It is built per CN code. Different grades under the same code can be reported on a single average.
No. The reporting period is the year of production or import, and cannot precede 2026.
We work on defining production processes, preparing the monitoring methodology and making the calculation verification-ready, under our CBAM accounting and reporting service. You can contact us with your questions.
Get in touch
If something you've read here connects to a live project, a reporting deadline, or a decision you're weighing — we're happy to have a useful conversation.
Contact us
Regulation & Compliance
Regulation & Compliance
Regulation & Compliance
Lets talk about your sustainability goals.