Blog
Publish: 17 Sep 26Reading Time: 4 Min
Cement's position under CBAM is unusual less because of the level of its emissions than because of their nature. Most of the emissions from clinker production come not from fuel but from the chemistry of the process, and cannot be reduced by changing fuel at all. Combined with the lowest value per tonne of any CBAM good, this gives cement the highest ratio of CBAM cost to product value in the mechanism.
Clinker production has two emission sources, and the distinction between them shapes the entire CBAM strategy for the sector.
Process emissions arise from the decomposition of limestone in the kiln. Calcium carbonate breaks down into calcium oxide and carbon dioxide, and the released CO2 is an unavoidable product of the reaction. Roughly two thirds of clinker's emissions come from this source, and it does not change whatever fuel is used.
Combustion emissions come from the fuels burned to heat the kiln. Alternative fuels, waste heat recovery and kiln efficiency all reduce this component.
The consequence is that reducing emissions intensity in cement does not run through fuel conversion. Fuel improvements affect about a third of the total; the real lever lies elsewhere.
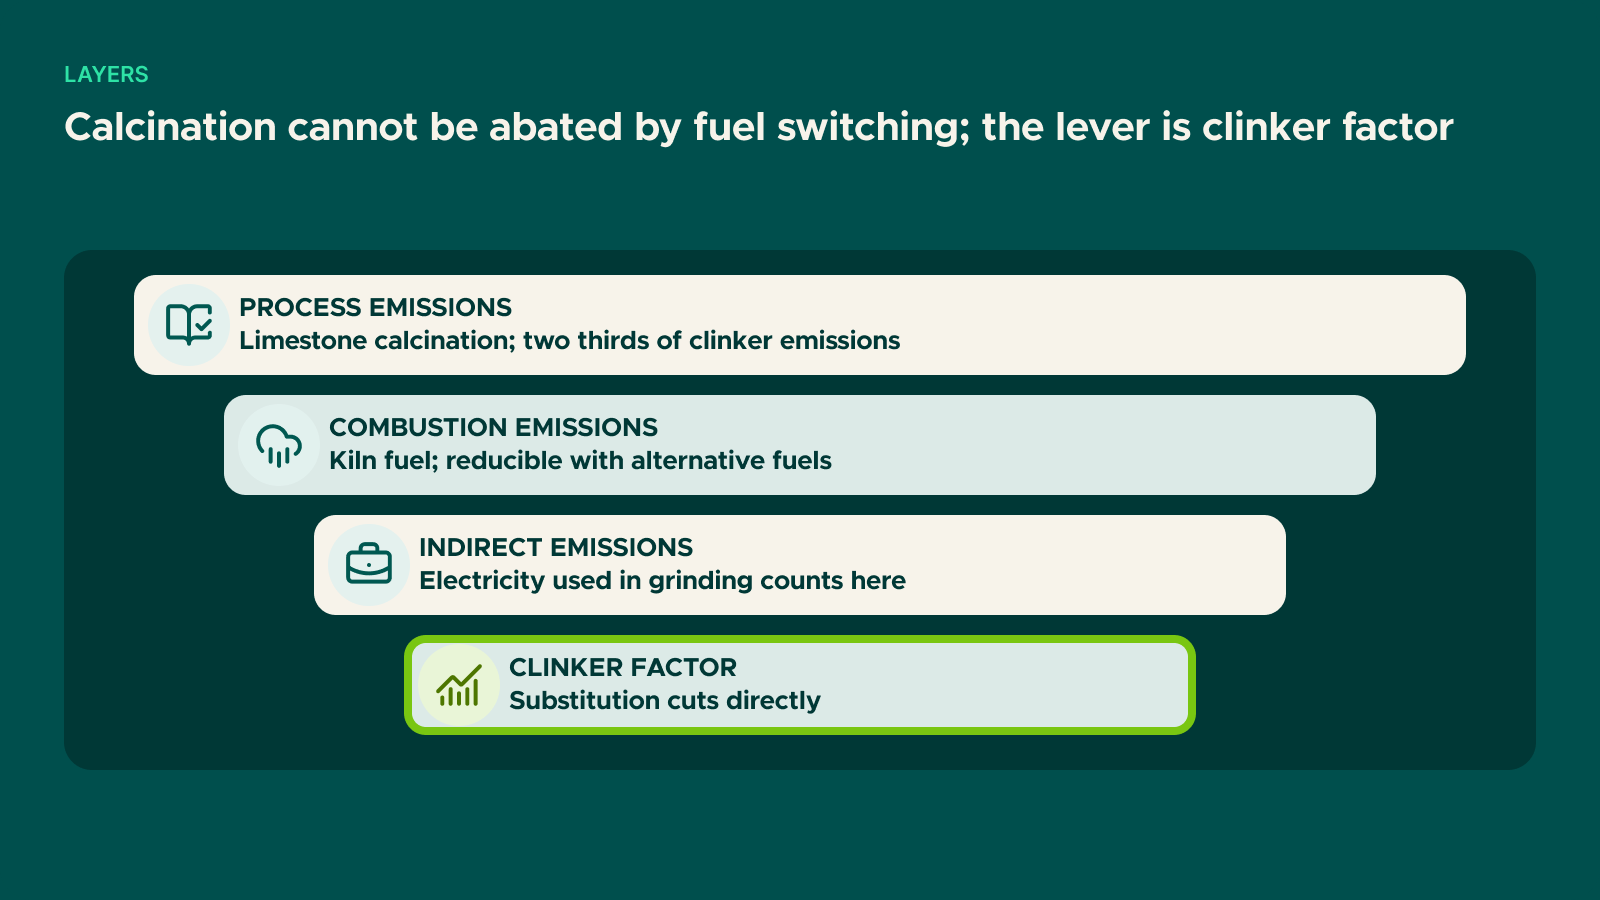
In CBAM the carrier of the cement calculation is clinker. Cement's embedded emissions are built on the quantity of clinker it contains, which makes the clinker factor — the proportion of clinker in the cement — the strongest available lever.
Substituting clinker with slag, fly ash, calcined clay, pozzolans or limestone reduces embedded emissions directly and roughly proportionally. Lowering a clinker factor from 90% to 70% produces a reduction of broadly similar magnitude.
Two qualifications apply. Substitute materials can carry their own emissions load — calcined clay brings its own calcination emissions. And clinker and cement sit under separate CN codes, so calculations are built separately: there is no substitution lever available when clinker itself is the exported good.
Cement is one of the three product groups where CBAM counts indirect emissions, alongside fertilisers and agglomerated iron ore. The emissions of purchased electricity are added to the embedded figure.
Electricity consumption in cement concentrates in grinding. Its share of total emissions is modest next to calcination, but as the clinker factor falls the volume of ground substitute material rises and the weight of indirect emissions increases. Clinker substitution therefore lowers direct emissions while raising indirect ones somewhat; the net gain remains clear, but both sides of the calculation need to be built together.
Using actual values for indirect emissions requires a direct technical connection, a power purchase agreement, or accepted renewable certificates — guarantees of origin do not qualify. The rules are in CBAM indirect emissions and electricity.
CBAM cost is calculated in euro per tonne. What determines its commercial significance is that figure as a proportion of the product's unit price.
Cement has the lowest value per tonne of any good in CBAM scope while carrying high emissions intensity. The combination puts the ratio of CBAM cost to product value at the top of the mechanism. The same absolute cost that is marginal for a high-value steel product bears directly on price competitiveness in cement.
The 2026 free allocation factor of 97.5% keeps that pressure contained for now. As the factor falls to 51.5% in 2030, however, the cost facing producers whose intensity exceeds the benchmark can reach a magnitude that outweighs the freight advantage of seaborne trade. We set out the projections in CBAM cost modelling 2026-2034.
The core of scope is CN 2523: cement clinker, white Portland cement, other Portland cements, aluminous cement and other hydraulic cements. Calcined kaolinic clays are also listed.
The precursor structure is comparatively simple: clinker is the covered precursor of cement. For grinding plants buying clinker, the supplier's data determines most of the figure; for integrated plants producing their own clinker, the calculation closes inside the installation. Integration is therefore an advantage in CBAM data management.
It affects combustion emissions only — roughly a third of the total. The effect increases where biomass content can be separately evidenced.
Captured and permanently stored CO2 can be taken into account, but the documentation and verification requirements are demanding.
No. Where clinker itself is exported there is no substitution lever; abatement is limited to combustion emissions and process efficiency.
Not for installations below the country average. Where the clinker factor is low, actual data is the only way to make that difference visible.
We work on building product-level emissions calculations for clinker and cement and preparing them for verification, under our CBAM accounting and reporting service. You can contact us with your questions.
Get in touch
If something you've read here connects to a live project, a reporting deadline, or a decision you're weighing — we're happy to have a useful conversation.
Contact us
Regulation & Compliance
Regulation & Compliance
Regulation & Compliance
Lets talk about your sustainability goals.