Blog
Publish: 17 Sep 26Reading Time: 4 Min
The most frequently repeated error about CBAM is that in 2026 the obligation amounts to only 2.5% of embedded emissions. That statement is true in exactly one case: where an installation's emissions intensity equals the benchmark precisely. Because the formula adds every unit above the benchmark to the obligation in full, installations with higher intensity face a material cost even in the first year of the regime.
The obligation is determined by four elements: the embedded emissions of the goods, the CBAM benchmark, the free allocation factor, and any carbon price already paid in the country of production.
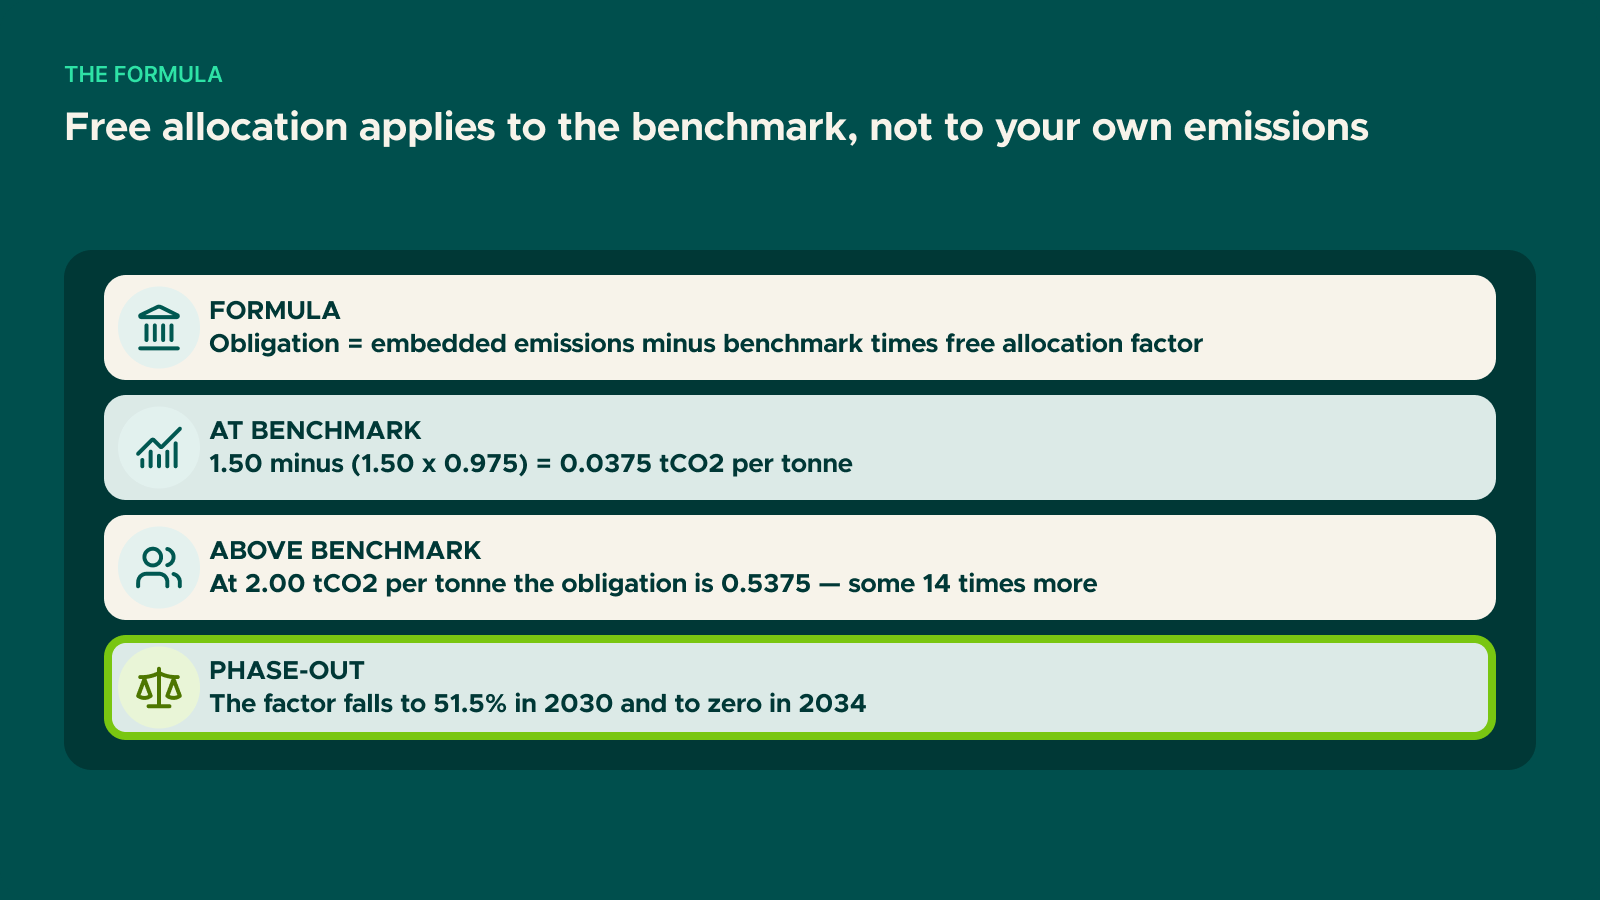
CBAM certificates due = embedded emissions − (CBAM benchmark × free allocation factor) − carbon price paid in the country of production
Each component is set by a different actor. Embedded emissions are determined by the producer — the only variable that can be influenced. The benchmark and the free allocation factor are set by EU law. The third-country carbon price is set by the policy of the producing country.
A benchmark is the reference emissions intensity set under the EU ETS for a product group, representing the performance of the most efficient EU installations making that good. Inside the ETS it determines how much free allocation a producer receives: an installation below the benchmark receives more allowances than it needs, one above it is short and buys the difference.
CBAM mirrors that structure on the import side. For as long as EU producers receive free allocation up to the benchmark, the same amount is deducted from the importer's obligation, so both sides are measured against the same reference.
Two details matter in practice. Separate benchmarks apply to actual-value and default-value calculations. And benchmarks are not static: CBAM benchmarks are to be revised from 2027 in line with the EU ETS benchmarks for the 2026-2030 period. Because ETS benchmarks tighten periodically, such revisions generally increase the obligation.
| Year | Free allocation factor | Deduction where benchmark = 1.50 |
|---|---|---|
| 2026 | 97.5% | 1.4625 |
| 2027 | 95% | 1.4250 |
| 2028 | 90% | 1.3500 |
| 2029 | 77.5% | 1.1625 |
| 2030 | 51.5% | 0.7725 |
| 2031 | 39% | 0.5850 |
| 2032 | 26.5% | 0.3975 |
| 2033 | 14% | 0.2100 |
| 2034 | 0% | 0 |
From 2034 there is nothing left to deduct, so the obligation equals the full embedded emissions and CBAM becomes a direct carbon cost.
The formula's decisive feature is that the deduction depends on the benchmark, not on the installation's own emissions. Free allocation is a percentage of a fixed reference, not a percentage of what was actually emitted.
The result is that intensity above the benchmark is penalised disproportionately. With a benchmark of 1.50 in 2026:
| Emissions intensity | Obligation | As share of emissions |
|---|---|---|
| 1.50 (at benchmark) | 0.0375 | 2.5% |
| 1.70 | 0.2375 | 14.0% |
| 2.00 | 0.5375 | 26.9% |
| 2.50 | 1.0375 | 41.5% |
The last column explains why the "2.5% of emissions" shorthand misleads. An installation operating 67% above the benchmark already sees 41% of its emissions generating an obligation in 2026.
This is the question producers ask most often, and the answer is nuanced: the absolute obligation cannot be calculated without the benchmark, but the competitive position can.
The benchmark is identical for all suppliers, so the difference in obligation between two suppliers equals the difference in their emissions intensity — the benchmark cancels out. An EU buyer comparing two quotes can therefore see which supplier generates the lower CBAM cost without knowing the benchmark at all. That makes emissions intensity a commercial differentiator rather than a compliance detail.
The CBAM return on an emissions-reduction investment equals the emissions avoided multiplied by the certificate price, and it is independent of the free allocation factor — because the factor applies to the benchmark, while a reduction in the installation's own emissions comes straight off the obligation.
This has an under-appreciated consequence: the CBAM return on abatement is the same in 2026 as in 2034. What changes is the cost of not abating. The payback calculation therefore favours bringing abatement forward rather than waiting for the years in which the factor falls. We model the trajectory in CBAM cost modelling 2026-2034.
Certificate pricing and the surrender mechanics are covered in CBAM certificates.
They are adapted from EU ETS benchmarks and set out in the implementing rules, with revision from 2027 based on the 2026-2030 ETS values.
No. The obligation does not go below zero; performing better than the benchmark reduces it towards zero but does not create a credit.
The annual values are set in the Regulation and do not change without legislative amendment. Scope and threshold revisions do not affect them.
Yes, but a separate benchmark applies for default-value calculations, and the mark-up added to the default value raises the net obligation.
We work on positioning installation intensity against benchmarks and building obligation projections, under our CBAM accounting and reporting service. You can contact us with your questions.
Get in touch
If something you've read here connects to a live project, a reporting deadline, or a decision you're weighing — we're happy to have a useful conversation.
Contact us
Regulation & Compliance
Regulation & Compliance
Regulation & Compliance
Lets talk about your sustainability goals.